- Home
- /
- Programming
- /
- Programming
- /
- how to repeatedly run regression for larger sets
- RSS Feed
- Mark Topic as New
- Mark Topic as Read
- Float this Topic for Current User
- Bookmark
- Subscribe
- Mute
- Printer Friendly Page

- Mark as New
- Bookmark
- Subscribe
- Mute
- RSS Feed
- Permalink
- Report Inappropriate Content
I have a file with 100 coloumns(each column is stock data for 5 years). I have to run OLS between every 2 stocks(proc reg with model statement), so output is going to be coefficients for 4950 (100*99/2) pair of stocks.
I can put proc reg in macro, but I have to call it 4950 times..or I can use matlab (with for loops) to make it less tedious.
Is there a better solution of doing this in SAS (besides macros). thank you
Accepted Solutions

- Mark as New
- Bookmark
- Subscribe
- Mute
- RSS Feed
- Permalink
- Report Inappropriate Content
Two ways of looping in SAS - BY statements or macro.
You could modify the dataset so that you only have two variables and using a by statement, but a macro seems simpler.
Or you can use Matlab or Octave with your for loops.

- Mark as New
- Bookmark
- Subscribe
- Mute
- RSS Feed
- Permalink
- Report Inappropriate Content
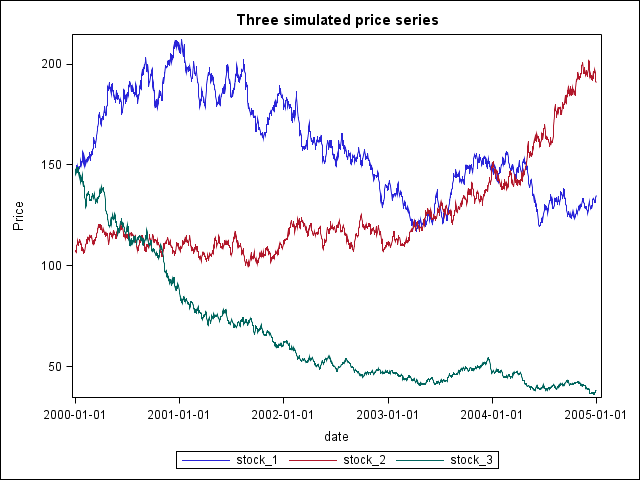
I am no economist or financial expert but the following simulation should warn you of a potential problem when looking for linear relationships between autocorrelated time series :
/* Generate 100 simulated daily price series */
data test;
format date yymmdd10. price 7.2;
call streaminit(658487);
do stock = 1 to 100;
price = 50 + 100 * rand('UNIFORM');
do date = '01jan2000'd to '31dec2004'd;
price = price * (1 + rand("NORMAL", 0.0, 0.01));
output;
end;
end;
run;
proc sort data=test; by date stock; run;
/* Make each simulated stock series into a table column */
proc transpose data=test out=table prefix=stock_;
by date;
id stock;
var price;
run;
/* Plot the first three series */
title "Three simulated price series";
ods graphics / antialiasmax=2000;
proc sgplot data=table;
series x=date y=stock_1 /lineattrs=(pattern=1);
series x=date y=stock_2 /lineattrs=(pattern=1);
series x=date y=stock_3 /lineattrs=(pattern=1);
xaxis type=time tickvalueformat=yymmdd10.;
yaxis label="Price";
run;
/* Find the 5 best correlations for each series */
ods listing select none;
proc corr data=table best=5 Pearson;
var stock_:;
ods output PearsonCorr=PC;
run;
ods listing select all;
options linesize=132;
title "Best correlated price series";
proc print data=PC(drop=best1 R1 P1) noobs; run;
You will notice that far too many relations appear as highly significant among these totally unrelated time series. Looking at the plot should give you a feeling why this happens.
PG
- Mark as New
- Bookmark
- Subscribe
- Mute
- RSS Feed
- Permalink
- Report Inappropriate Content
Two ways of looping in SAS - BY statements or macro.
You could modify the dataset so that you only have two variables and using a by statement, but a macro seems simpler.
Or you can use Matlab or Octave with your for loops.

Don't miss out on SAS Innovate - Register now for the FREE Livestream!
Can't make it to Vegas? No problem! Watch our general sessions LIVE or on-demand starting April 17th. Hear from SAS execs, best-selling author Adam Grant, Hot Ones host Sean Evans, top tech journalist Kara Swisher, AI expert Cassie Kozyrkov, and the mind-blowing dance crew iLuminate! Plus, get access to over 20 breakout sessions.
Learn how use the CAT functions in SAS to join values from multiple variables into a single value.

Find more tutorials on the SAS Users YouTube channel.
 Click image to register for webinar
Classroom Training Available!
Select SAS Training centers are offering in-person courses. View upcoming courses for:
-
2 replies
-
03-15-2013 07:25 PM
-
706 views
-
3 likes
-
3 in conversation
-
