Before you select the best model based on your favorite goodness of fit statistic – Mean Squared Error, Gini, K-S, AUC, or misclassification rate – STOP! Model performance metrics are not a one size fits all measure. As an analyst, selecting the right performance metric might mean the difference between having an exceptionally good result, and having no result.
The classic example: There is only a 3% prevalence of the event of interest in my data. I can build a model that is 97% accurate (3% error rate) that NEVER detects the event of interest! In fact, I don’t even need to build a model to get this result – I can just guess “No” 100% of the time.
Much of the time, the reason you are modeling a binary outcome is that you are faced with limited resources and you are trying to determine what efforts to focus on to maximize returns. While these classic performance metrics may allow an understanding of overall fit, they are not very helpful in discerning which model provides the best performance at a certain depth in the list. Rather than looking at the overall performance of the model, you need to look at the tails.
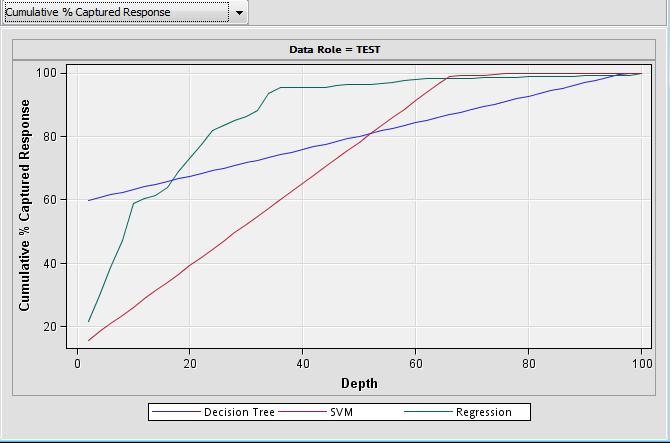
In the ‘Cumulative % Captured Response Chart’ below, the performance of 3 models developed in Enterprise Miner is shown. If I can only go after 2% of the population, I would select the Decision Tree Model where I can capture 60% of the response. Conversely, if I want to drop the 20% least likely cases, I should select the SVM. Just eyeballing this chart, I might think that the regression model gives the best result – and it has the highest ROC and Gini Coefficient.
In this modeling scenario, I focused my efforts with finding the model that performs the best on the tails. Other approaches may need to be considered depending on your objective: minimizing false positives in fraud detection, minimizing false negatives in health care, or identification of the most stable model. As always, the business objective needs to be considered every step along the way.

