- Home
- /
- Programming
- /
- Graphics
- /
- Re: How do I rotate the bar values in proc SGPLOT
- RSS Feed
- Mark Topic as New
- Mark Topic as Read
- Float this Topic for Current User
- Bookmark
- Subscribe
- Mute
- Printer Friendly Page

- Mark as New
- Bookmark
- Subscribe
- Mute
- RSS Feed
- Permalink
- Report Inappropriate Content
Hi there,
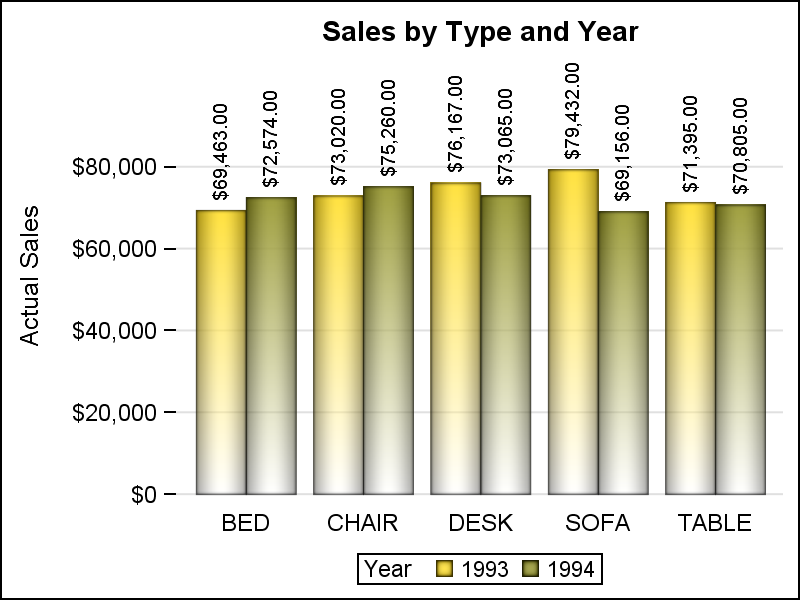
I am trying to produce a graph like the one below. That is not my graph but just for reference. In the graph below, the bar values are rotated vertically, I am trying to rotate my values at an angle. I read somewhere that the values will be automatically rotated to a vertical position when the values don't fit in the space, however I need to have my values rotated even though I only have 5 digits number ( for example 45,000).
This is the code I am using and I am using SAS 9.4:
proc sgplot data=table1 noborder;
where label='Avg Size' and state=10;
format ld1 comma.;
vbar year/ response=ld1 datalabel datalabelattrs=(size=12)
barwidth =0.2
dataskin=gloss
baselineattrs=(thickness=0)
fillattrs=(color=green);
xaxis display=(nolabel noticks) ;
yaxis display=none ;
run;

- Mark as New
- Bookmark
- Subscribe
- Mute
- RSS Feed
- Permalink
- Report Inappropriate Content
Hi and welcome to the SAS communities 🙂
You can use
datalabelfitpolicy=rotatein the VBAR Statement Options.

- Mark as New
- Bookmark
- Subscribe
- Mute
- RSS Feed
- Permalink
- Report Inappropriate Content
We currently do not have a ROTATEALWAYS option for DATALABELFITPOLICY; however, if the values are close to the edge of the bars, you can make the rotation kick in by shrinking the BARWIDTH a little more.
Hope this helps!
Dan
- Mark as New
- Bookmark
- Subscribe
- Mute
- RSS Feed
- Permalink
- Report Inappropriate Content
I just learned something. I thought the DATALABELFITPOLICY=ROTATE would rotate the data label values no matter what.
@DanH_sas thank you for clarifying. Will we see a ROTATEALWAYS Option for DATALABELFITPOLICY in a future release?
- Mark as New
- Bookmark
- Subscribe
- Mute
- RSS Feed
- Permalink
- Report Inappropriate Content
We'll see what we can do 🙂
Thanks!
Dan
- Mark as New
- Bookmark
- Subscribe
- Mute
- RSS Feed
- Permalink
- Report Inappropriate Content
Thank you for this information!

- Mark as New
- Bookmark
- Subscribe
- Mute
- RSS Feed
- Permalink
- Report Inappropriate Content
How about this one ?
proc summary data=sashelp.class nway;
class age sex;
var height;
output out=temp sum=;
run;
data temp;
 set temp;
 if sex='M' then h1=height;
  else h2=height;
run;

proc sgplot data=temp;
vbarparm category=age response=height  /group=sex groupdisplay=cluster ;
text x=age y=h1 text=h1/ discreteoffset=0.2 rotate=90 strip;
text x=age y=h2 text=h2/ discreteoffset=-0.2 rotate=90 strip;
run;
- Mark as New
- Bookmark
- Subscribe
- Mute
- RSS Feed
- Permalink
- Report Inappropriate Content
This should work. I am thinking you can use TEXT statement with GROUP and GROUPDISPLAY=Cluster to match the VBARPARM. This will make it more scale-able to different group levels.
- Mark as New
- Bookmark
- Subscribe
- Mute
- RSS Feed
- Permalink
- Report Inappropriate Content
Thanks. As you said.
proc summary data=sashelp.class nway;
class age sex;
var height;
output out=temp sum=;
run;


proc sgplot data=temp;
vbarparm category=age response=height  /group=sex groupdisplay=cluster ;
text x=age y=height text=height/group=sex groupdisplay=cluster rotate=90 strip;
run;
April 27 – 30 | Gaylord Texan | Grapevine, Texas
Registration is open
Walk in ready to learn. Walk out ready to deliver. This is the data and AI conference you can't afford to miss.
Register now and lock in 2025 pricing—just $495!
Learn how use the CAT functions in SAS to join values from multiple variables into a single value.

Find more tutorials on the SAS Users YouTube channel.
SAS Training: Just a Click Away
Ready to level-up your skills? Choose your own adventure.
-
8 replies
-
02-05-2019 10:32 AM
-
6129 views
-
1 like
-
5 in conversation
-
